In recent years, financial institutions in the UK have faced significant challenges due to rising delinquency rates. The economic instability caused by the COVID-19 pandemic has led to an increase in loan defaults and financial losses. According to a report by S&P Global Market Intelligence, major British banks made provisions against loan losses of more than £7.5 billion in the first quarter of 2020, nearly six times the amount set aside in the same period the previous year. These provisions reflect the anticipated rise in credit losses, which are estimated to reach £18.5 billion:[S&P Global].
The Bank of England’s Financial Stability Report of June 2024 highlights that mortgage arrears are expected to rise significantly, with an estimated 128,000 cases of mortgage arrears projected by the end of 2024, up from 105,600 cases at the end of the previous year. This increase in arrears is attributed to higher living costs and economic uncertainty, affecting borrowers’ ability to meet their financial obligations:[Bank of England].
Given this context, it is crucial for financial institutions to develop robust predictive models to identify and mitigate the risks associated with loan delinquencies. Our project focuses on developing analytical insights to predict loan delinquency using basic Python programming and NumPy. By leveraging historical loan data, we aim to provide financial institutions with actionable insights to enhance their risk management strategies and reduce potential losses due to delinquency.
Problem Statement
In the wake of the COVID-19 pandemic, UK financial institutions have experienced a notable increase in loan delinquencies. The economic downturn has exacerbated the financial instability of many borrowers, leading to higher default rates. Developing predictive models to foresee and mitigate these delinquencies is imperative for maintaining financial stability and minimizing losses.
Insights from Loan Delinquency Analysis
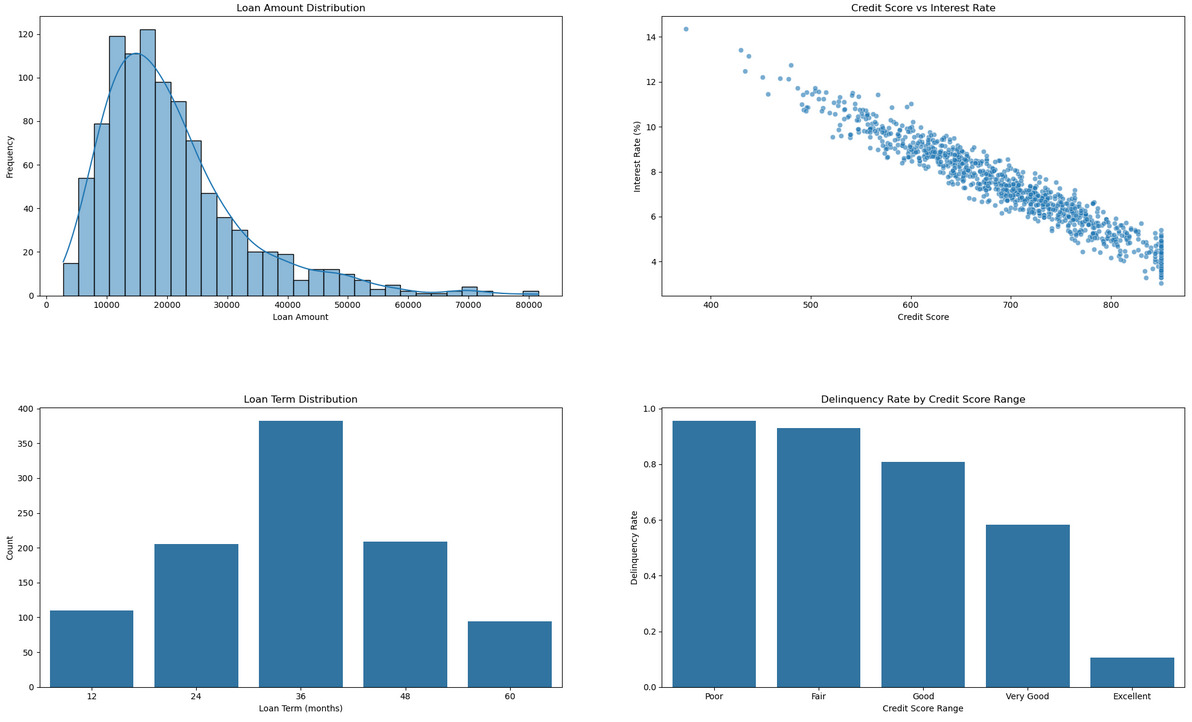
Loan Amount Distribution
The loan amount distribution is right-skewed, with most loans ranging between £10,000 and £30,000. This indicates that higher-value loans are less common.
Credit Score vs. Interest Rate
There is a clear negative correlation between credit scores and interest rates, highlighting that borrowers with higher credit scores are offered lower interest rates.
Loan Term Distribution
Medium-term loans (36 months) are the most common, suggesting borrowers prefer a balance between monthly payments and total interest paid.
Delinquency Rate by Credit Score Range
Delinquency rates are highest among borrowers with poor and fair credit scores, indicating higher financial risk for these groups.
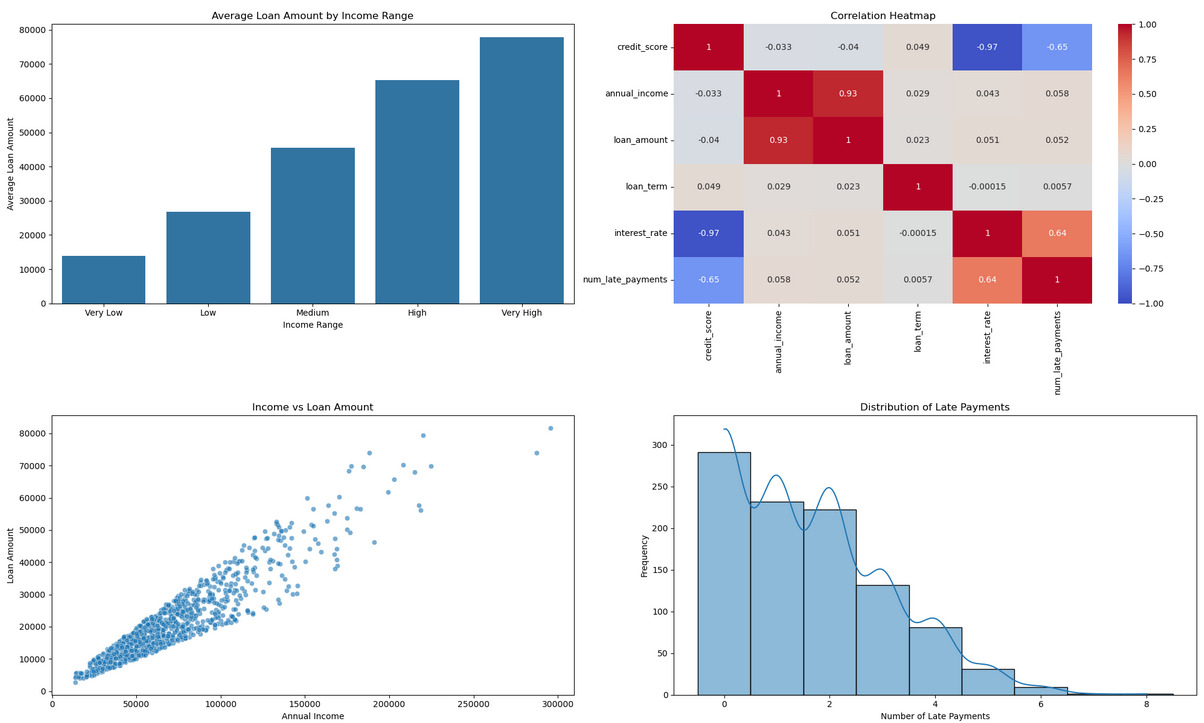
Average Loan Amount by Income Range
Higher income ranges are associated with larger loan amounts, showing that income level significantly influences the loan amount approved.
Correlation Heatmap
Strong positive correlations between annual income and loan amount, and negative correlations between credit score and interest rate, affirm the relationships identified in the data.
Income vs. Loan Amount
A positive linear relationship between annual income and loan amount underscores that higher incomes lead to higher loan amounts.
Distribution of Late Payments
Most borrowers have zero to one late payment, while a smaller proportion has multiple late payments, indicating varying levels of financial management among borrowers.


Code Snippets
Data Generation
import numpy as np
import pandas as pd
from faker import Faker
from datetime import datetime, timedelta

# Set random seed for reproducibility
np.random.seed(42)
fake = Faker()

def generate_loan_data(num_loans=1000):
    data = {
        'loan_id': range(1, num_loans + 1),
        'customer_name': [fake.name() for _ in range(num_loans)],
        'credit_score': np.random.normal(700, 100, num_loans).clip(300, 850).astype(int),
        'annual_income': np.random.lognormal(11, 0.5, num_loans).astype(int),
        'loan_term': np.random.choice([12, 24, 36, 48, 60], num_loans, p=[0.1, 0.2, 0.4, 0.2, 0.1]),
        'loan_start_date': [fake.date_between(start_date='-5y', end_date='today') for _ in range(num_loans)],
    }

    df = pd.DataFrame(data)

    # Calculate loan amount based on income (with some randomness)
    df['loan_amount'] = (df['annual_income'] * np.random.uniform(0.2, 0.4, num_loans)).astype(int)

    # Calculate interest rate based on credit score and loan term
    df['interest_rate'] = 15 - 0.02 * (df['credit_score'] - 300) + 0.1 * (df['loan_term'] / 12)
    df['interest_rate'] += np.random.normal(0, 0.5, num_loans)
    df['interest_rate'] = df['interest_rate'].clip(3, 25).round(2)

    # Calculate loan end date
    df['loan_end_date'] = df.apply(lambda row: row['loan_start_date'] + timedelta(days=30*row['loan_term']), axis=1)

    # Simulate payment history based on credit score
    prob_late = 0.5 - (df['credit_score'] - 300) / 1100
    for month in range(1, 13):
        df[f'payment_month_{month}'] = np.random.random(num_loans) < prob_late

    return df
def analyze_loan_data(df):
    total_loans = len(df)
    total_loan_amount = df['loan_amount'].sum()
    avg_loan_amount = df['loan_amount'].mean()
    avg_interest_rate = df['interest_rate'].mean()
    avg_credit_score = df['credit_score'].mean()

    payment_columns = [col for col in df.columns if col.startswith('payment_month_')]
    df['num_late_payments'] = df[payment_columns].sum(axis=1)
    df['is_delinquent'] = (df['num_late_payments'] > 0).astype(int)
    delinquency_rate = df['is_delinquent'].mean()

    loans_by_term = df.groupby('loan_term')['loan_amount'].agg(['count', 'sum', 'mean'])

    credit_score_interest_correlation = df['credit_score'].corr(df['interest_rate'])
    income_loan_amount_correlation = df['annual_income'].corr(df['loan_amount'])

    return {
        'total_loans': total_loans,
        'total_loan_amount': total_loan_amount,
        'avg_loan_amount': avg_loan_amount,
        'avg_interest_rate': avg_interest_rate,
        'avg_credit_score': avg_credit_score,
        'delinquency_rate': delinquency_rate,
        'loans_by_term': loans_by_term,
        'credit_score_interest_correlation': credit_score_interest_correlation,
        'income_loan_amount_correlation': income_loan_amount_correlation,
    }
def create_visualizations(df, analysis_results):
    import matplotlib.pyplot as plt
    import seaborn as sns

    plt.figure(figsize=(20, 25))

    # 1. Loan Amount Distribution
    plt.subplot(4, 2, 1)
    sns.histplot(df['loan_amount'], kde=True)
    plt.title('Loan Amount Distribution')
    plt.xlabel('Loan Amount')
    plt.ylabel('Frequency')

    # 2. Credit Score vs Interest Rate
    plt.subplot(4, 2, 2)
    sns.scatterplot(data=df, x='credit_score', y='interest_rate', alpha=0.6)
    plt.title('Credit Score vs Interest Rate')
    plt.xlabel('Credit Score')
    plt.ylabel('Interest Rate (%)')

    # 3. Loan Term Distribution
    plt.subplot(4, 2, 3)
    sns.countplot(data
These insights and analysis results provide a comprehensive understanding of the loan data, highlighting key trends and relationships that can help financial institutions improve their risk management strategies. The ability to predict and mitigate loan delinquency risks can significantly enhance financial stability and profitability.
For more details on the code and analysis, please refer to the GitHub repository.